The Brede equation
One of my favorite turf hacks for the stimpmeter and green speed
The Brede equation (see footnote1) is essential to my work. I often use the stimpmeter to measure the ball roll distance (green speed) of putting greens. But there’s a problem. It can take a long time to find an area flat enough to make the measurement. On some greens, there is so much slope that one cannot make an official measurement. By official I mean the difference between the distances rolled in two directions must be less than 18 inches (45 cm).2
Enter the Brede equation. I wrote this in a report about putting green performance characteristics:
The Brede equation is extremely useful. On most golf course putting greens, it is difficult to find flat areas to make a stimpmeter reading. In this project [as of August 2012], I collected green speed data from 210 greens and even in places where the green seemed to be relatively flat, the difference in roll between the uphill and downhill direction was often more than 45 cm. When green speed readings are made, a location at the edge or corner of a green is often selected, not because it is a representative area of the green, but simply because that corner or ridge is flat enough to get a valid reading. Alternatively, slightly sidehill rolls are sometimes made, so that the difference between the two rolls is less than 45 cm, even though the sidehill roll causes a curve that introduces error into the reading.
I’ve taken another look at those measurements up to 2012, and added in measurements from hundreds of greens since then.
On a flat surface, defined here as one in which the difference between the longer and shorter rolls is 18 inches or less, there is negligible error because of slope. But does the error ever increase when measuring on a sloped surface! There’s a reason the stimpmeter instruction booklet says “should the difference in length between the first and second series be greater than 18 inches, the accuracy of the resulting average is questionable.”
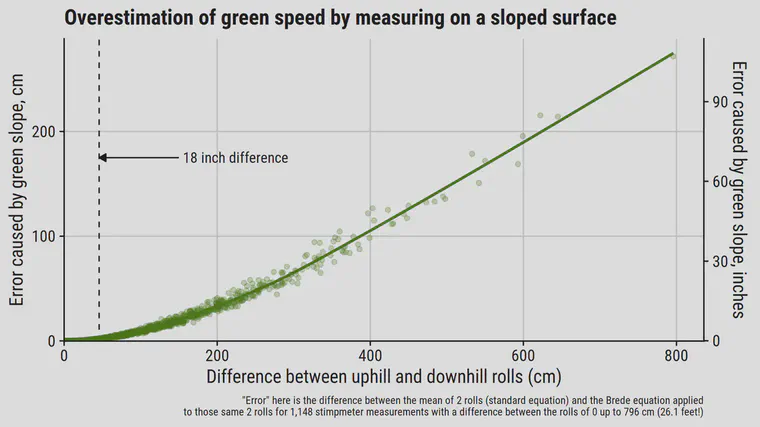
“Error” in these charts is the difference between the standard equation, which takes the arithmetic mean of the two distances, and the Brede equation, which accounts for the slope. And that is some error!
The data shown above are from 1,148 stimpmeter measurements, and the maximum distance I’ve measured between uphill and downhill rolls is 796 cm—more than 26 feet!3 Do crazy rolls like that and you get a ton of error. The stimpmeter measurement in that particular case would have been overestimated by 8.9 feet.
This next chart zooms in to the zone that includes valid measurements. Those are where the difference between uphill and downhill distances is 18 inches or less.
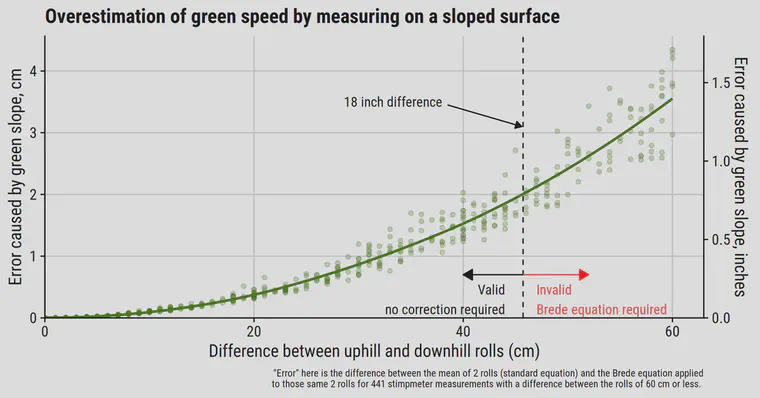
There is less than 1 inch of overestimation at a difference of 18 inches, but the overestimation goes up rapidly as the measurements are made on increasingly sloped surfaces.
I want to point out three things in summary.
A stimpmeter measurement is conducted when the difference between rolls in the uphill and downhill direction is 18 inches or less. When you do as I do, and sometimes measure to a difference of more than 18 inches, the measurement is no longer officially a stimpmeter measurement. The number you get after applying the Brede correction is correct, in that it matches the stimpmeter measurements of flat areas. See point 3 below. But just be aware that this is breaking the rules by not following the instructions in the USGA’s stimpmeter instruction booklet.
The Brede equation works perfectly, and when you do this for the first few times you’ll think it is almost like magic, so long as one important requirement is met. The uphill and downhill rolls need to be made on a relatively uniform slope. Concave or convex slopes don’t work.
The Brede equation for sloped areas gives a result that is functionally equivalent to official stimpmeter measurements from flat areas of the same green. In this project I’ve taken multiple measurements from the same greens, so I sometimes have a measurement from a flat area, that I can call official, and then I sometimes have measurements from sloped areas of the same green to compare to that “official” measurement. And on some greens I have multiple measurements from different flat areas, so I can compare those official measurements to themselves, too. On flat surfaces, going from one spot to another flat spot on the same green, the median difference (n = 124) in stimpmeter measurement is 8.8 cm (3.5 inches). When going from a known “official” stimpmeter measurement from a flat area, to a sloped area on the same green, the median difference (n = 466) is 9.2 cm (3.6 inches).
The equation is $S = \frac{2ab}{a + b}$ where $S$ is the ball roll distance, or we could also call this the corrected green speed, and $a$ is the ball roll distance in the uphill direction (the shorter roll) and $b$ is the ball roll distance in the downhill direction (the longer roll). Note the differences from the standard equation for calculating ball roll distance which is the arithmetic mean of the uphill and downhill direction, limited to a maximum difference between the two directions of 18 inches: $S = \frac{a + b}{2}$. ↩︎
Or in the case of using the 2x notch (a “half-roll”), the difference in roll in the 2 different directions must be 9 inches or less. ↩︎
This particular measurement was at Bangpra GC in Thailand, which has rather sloped korai (manilagrass) greens. The roll in the downhill direction was 981 cm and the roll in the uphill direction was 185 cm. With the standard equation this is 19.1 feet, an error of 8.9 feet. Using the Brede equation the measurement was 10.2 feet. ↩︎