An example of ample DLI

In a recent ATC Doublecut discussing light and temperature, I mentioned that I’d calculate potential DLI for the recording location, check the actual DLI for the recording location, and share that information.

I’ve looked that up, made a chart, and wanted to explain this again real quick with one more example.
My assessment, after checking data for a lot of places, is that temperature generally plays a controlling role in how much the grass can grow. Light from the sun1 rarely provides a continuous limit on growth, especially on cool-season grass growth, in the same way.
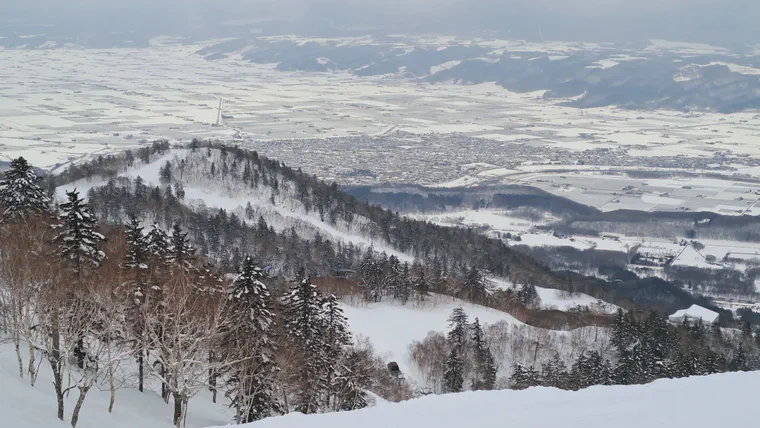
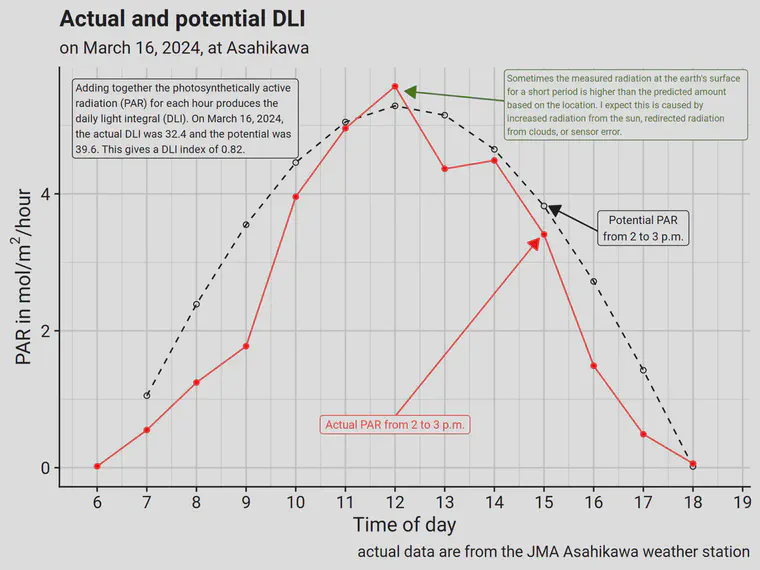
Figure 1 shows a snow-covered landscape. Grass is not growing. But there’s plenty of photosynthetically active radiation. I looked up the DLI data for a nearby JMA station with a sensor, and those data are shown in Figure 2. On March 16, the day I recorded that episode, the DLI was 32.4 mol/m2. If it wasn’t for the partly cloudy skies, the DLI would have been close to 39.6 mol/m2. Note that even this early in the season, that’s more light than cool-season grass can use.2
Meanwhile, in all this glorious sunshine, the high temperature on March 16 at this location was 3.8 °C, and the low temperature was -7 °C, with an average temperature of -1.3 °C. That gives a C3 growth potential (GP) of 0.
Does the GP prediction improve by adding an adjustment for light on this date, and in this location? I would argue that an adjustment doesn’t improve anything in this case.
This is not a discussion of tree or structural shade. This is about sun, clouds, location on the planet, and day of the year, and the amount of light that reaches the earth’s surface. ↩︎
The midday PPFD was often above 1,000 µmol/m2/s, which is the conventional light saturation point for C3 grasses. ↩︎