Bah! Humbug! Why the concept of “exchangeable” vs. “available” nutrients is a fallacy
This concerns the use of saturated paste (water) or dilute water extractants for assessing soil nutrient content, and specifically if data from those tests are a good way to decide if an element should be supplied as fertilizer. I wrote about this in “If you want to use soil test results to develop a fertilizer program, use a different extraction method.”
Frank Schäfer subsequently wrote with more questions about this:
I was listening to a speech where they were talking about difference by knowing what is in the soil by a soil test or knowing what is plant available by the soluble paste test. By using MLSN for the soil test, I can keep nutrients on an estimated level, but will that provide enough for the grass? Or can it be that maybe one element is missing in the plant even when soil test levels are fine to high? Did you ever combine the two tests?
Those are interesting questions. The short answer is, Bah! Humbug! And there is a simple reason such talk is humbug. There are no proper scales by which one can interpret paste extracts of nutrients. So one can’t classify the results of a water-based extraction.
The longer explanation to those questions begins with this. The different soil test methods provide, in the idealized situation of having similar soils, for example testing at the same site over and over again in a research project, the same information, so there is no additional information gained by doing both tests. That is the best case scenario—no information gain. One could do one test, or the other, and get the same decision-making information. That works if you are a researcher and do your own soil test calibration and make sure you always use very similar soils so the water extractant data can be used.
In the real world situation, where there are different soils—this could be from one site to another, or from a loamy soil in one area of a property to a sandy soil in another area of the property—there isn’t much use in water-based extractants like a saturated paste. Why?
First, there is no calibration data for those water-based extractants. So one can get a result for K like 6 ppm. Is 6 ppm low? Or is 6 ppm high? Does it mean that K is plant available? Or is it not plant available? Good luck answering that question. I’ve suggested to use a different extraction method. If you use a different method you will be able to interpret the data to determine if a nutrient is required as fertilizer. I like to use the MLSN guidelines. You can also consult, for example, the SLAN guidelines of Carrow et al.
A second reason there isn’t much use in the data from a water-based extractant is because all the water soluble nutrients in the soil are also extracted by Mehlich 3 or normal ammonium acetate or any conventional soil test extractant. When one is looking at test results from a standard extractant, the elements that would be extracted in a paste test or any water-based test are already included.
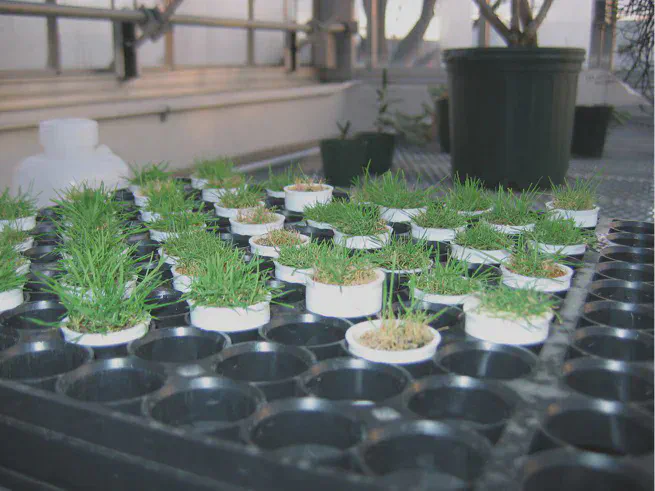
Let me explain this in another way with results from an experiment I did growing Penn A-1 creeping bentgrass from seed in different sands from around the world.

Nitrogen and phosphorus were added in equal amounts to each of the containers, and each container was a different sand. Those sands naturally contained different amounts of potassium (K), and I wanted to see how the grass growth was influenced by the amount of K in the soil.
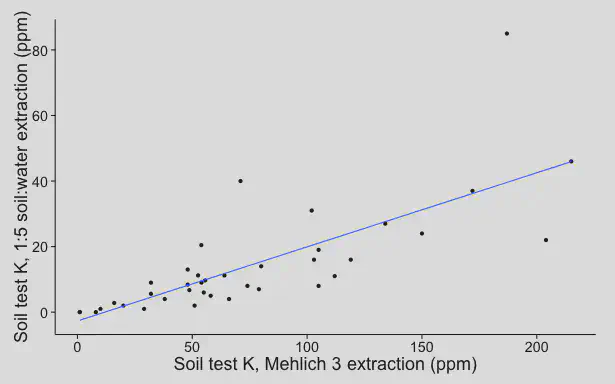
I measured the soil K using different methods. Here is the Mehlich 3-extractable K, plotted against the water-extractable K.

Each one of those points on the plot is a different sand rootzone. There is not a perfect correlation between the Mehlich 3 K and the 1:5 H20 K. But it is important to remember that the Mehlich 3 test extracts all the water soluble K and then some more. All the data from the water extractant is included in the Mehlich 3 data. This is important.
We are not concerned about having too much K. That would be great—if we had that we would never have to apply K fertilizer. What we are concerned about is the low end, being sure that we can identify the soils in which there is not enough K for the grass, so that we can add necessary K fertilizer. Take a look at the bottom left corner of the graph. That is where the water extract is measuring the lowest levels of K. Guess what? Those are the exact same soils in which the Mehlich 3 test is detecting low K too. These tests are providing the same information.
I also looked at these results by comparing the soil K to the clipping yield. I did a Cate-Nelson analysis to divide the sands into two groups—those that will probably have a large response to K addition, and those that will probably have little or no response. To do that, I used the R code provided by Mangiafico in his paper from Journal of Extension: Cate-Nelson Analysis for Bivariate Data Using R-project.
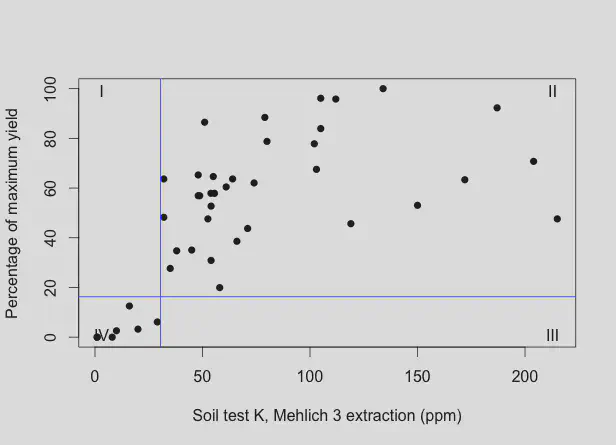
Here is the Cate-Nelson plot for Mehlich 3 K vs. clipping yield.

In a Cate-Nelson analysis, the data are partitioned into 4 quadrants (I, II, III, and IV), with the quadrants being set to maximize the number of data points falling in quadrants II and IV. The level of x at which the vertical line divides the data is termed the critical level. Below that level of x, and one can expect a response in y if x is increased. If the soil test K is above the critical level of x, there is not such a high expectation of a response in y if x is increased.
As an aside, the critical level of Mehlich 3 K from these data is 30.5 ppm. The MLSN guideline for K is 37 ppm. The MLSN guidelines are conservative, in that the MLSN guideline is not the absolute lowest level at which good turf performance can be achieved. There is a safety margin built in, and as long as one keeps the soil from dropping below the MLSN guideline, I’m confident that element will not be limiting.
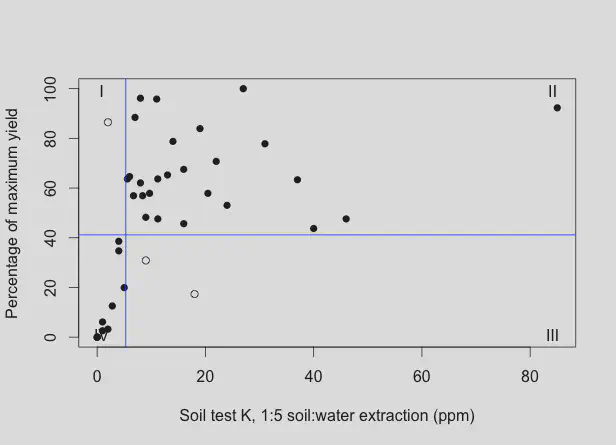
How about the Cate-Nelson plot for the 1:5 H2O extractable K in this experiment?

The critical value for the 1:5 H2O extraction determined by the Cate-Nelson analysis is 5.3 ppm. The value is different from Mehlich 3, of course, because water is a different extractant, extracting a different pool of nutrients, but the information is the same.
There are ten sands that fell in quadrant IV in the Cate-Nelson analysis of the 1:5 H2O data, and seven sands that fell in quadrant IV in the analysis of the Mehlich 3 data. If the sample is in quadrant IV, there is an expectation that clipping yield will increase with an increase in soil potassium. All seven of the sands that fell in quadrant IV in the Mehlich 3 analysis were also in quadrant IV in the 1:5 H2O analysis. There were three more in quadrant IV with the 1:5 H2O data, but there was also one in quadrant I and two in quadrant III. This suggests that the water extractant is a little more sensitive, but also more variable.
If we would make fertilizer decisions based on these data, we don’t want to have any points in quadrant III. That is where the soil test says there is enough, but the yield isn’t good. We don’t want points in quadrant I either, because soils in that quadrant don’t respond to fertilizer, but this analysis would be recommending it. We also don’t want to have data that should be in quadrant IV, but is missing.
So if we look at a comparison of the Mehlich 3 and 1:5 H2O extractants in this experiment, we see that both are giving us virtually the same information. And both methods have three undesirable data points. The water extractant has two in quadrant III and one in quadrant I, and the Mehlich 3 has three less than the water in quadrant IV.
This may be interesting for research purposes, but it doesn’t add anything to soil test interpretation for turfgrass managers. Turfgrass managers need to answer two questions. Is this element required as fertilizer? How much of this element is required as fertilizer? Conventional soil tests, preferably interpreted using the MLSN guidelines, answer both of those questions. Using water as an extractant doesn’t answer either of those questions, and in a best case scenario will provide only the same information as a conventional test, but no more.