Mehlich 3 soil test P in sand rootzones
Normal range of test results
Soil test phosphorus (P) is present across a wide range in golf course putting green rootzones. I looked at ATC data from putting greens for the past five years. For 1,773 soil test results using the Mehlich 3 extractant, the median is 46 ppm, the mean is 58 ppm, the minimum is 4 ppm, and the maximum is 313 ppm.
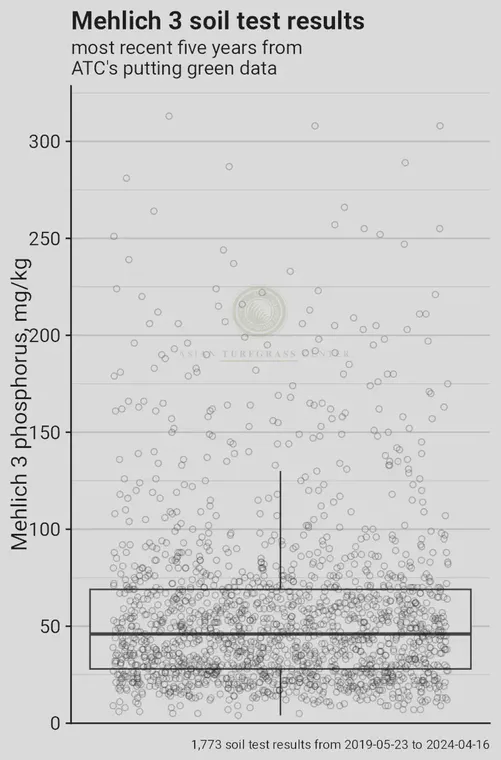
The chart above shows those data as a scatterplot (each point is a single soil test result) on top of a box plot. The box plot shows the horizontal bar with the median at 46 ppm, and it has hinges at 28 ppm to mark the 25th quartile and at 69 ppm to mark the 75th quartile. The vertical line that extends down from the lower hinge, and the vertical line that extends from the upper hinge, are showing the normal range of the data. These lines extend to the largest and smallest values that are within 1.5 times the interquartile range (the range from 69 to 28 ppm, or 41, times 1.5: a maximum of 61.5 ppm) from the hinges. The lines give some idea of which data are unusually high or low. Outliers, we could say, given this entire set of 1,773 test results. Notice that the outliers are all on the high side—sometimes a soil can end up with a lot of P in it.
The rate of P depletion
I use soil test results to make a site specific fertilizer recommendation using the MLSN method. The amount of P recommended is site specific (see this post for more); there’s no specific cutoff value at which P fertilizer will or will not be recommended. The expected plant use of P, and the duration of time over which the recommendation is made, will find how much P will be recommended.
The way the math works out, a lot of the greens in this dataset get a recommendation of “No P should be applied for the next year.” I want to show how Mehlich 3 P (M3P) tends to change in putting green rootzones, and to do that, I’ll use the examples of three golf courses that started with M3P above 100 ppm.
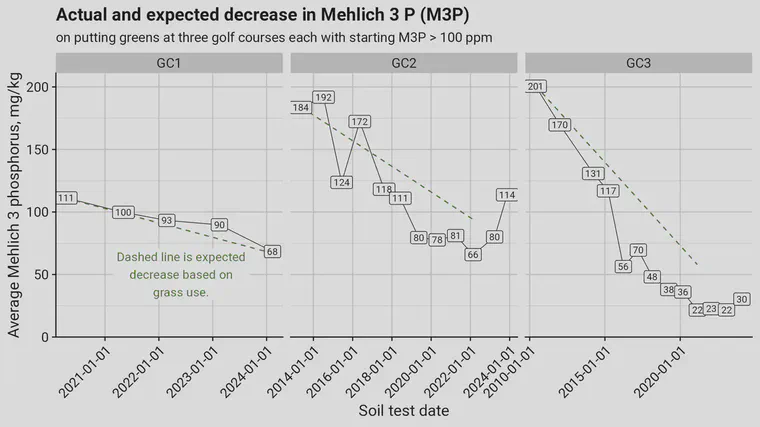
Golf course 1 (GC1) first did a soil test with ATC in spring of 2020. The first test for M3P was at 111 ppm and got my recommendation to GC1 was for no P fertilizer, because there is plenty of P in the soil to meet all the grass requirements for the next year. After four growing seasons on creeping bentgrass greens, and no P fertilizer, the M3P dropped to 68 ppm. That’s an average decline of 11 ppm per year. Based on GC1’s annual N rate of 12 g/m2, the expected plant use of P would reduce soil P by 10 ppm. In the range from 111 to 68 ppm, the decline in M3P almost exactly matched the expected decline.
Golf course 2 (GC2) first did a soil test with ATC in the spring of 2013. The first test for M3P was at 184 ppm. You can guess the recommendation I made: P fertilizer should not be applied because 100% of the grass’s P requirements can be supplied by the ample P in the soil. The M3P went down, and down, and I kept making that recommendation for almost ten years. The P hit a low of 66 ppm in the late winter of 2022. From 2013 to 2022, the average decline in soil P was 13 ppm per year. Based on the expected use from the korai (zoysiagrass) greens, the expected plant use would reduce soil P by 10 ppm per year. Considering all the variables involved, that’s really similar.
Golf course 3 (GC3) first did a soil test with ATC in the spring of 2010. The first test for M3P was at 201 ppm. The report stated, as you would expect with that level of M3P, that no P fertilizer should be applied. GC3 continued to do soil tests, and the M3P was checked each time, and finally the M3P dropped to a low of 22 ppm in the late winter of 2021. Over those eleven growing seasons, The M3P in these bentgrass greens went down by an average of 16 ppm per year. Based on the expected plant use of P from the bentgrass greens at this site, the expected annual decline in M3P was 13 ppm per year. As with the GC1 and GC2 declines in M3P, the actual decline matches closely with the expected decline.
Checking the location of P depletion
When the soil P is above 100 ppm, the M3P went down on two out of three golf courses at a faster rate than predicted. Maybe the calculations I made have some errors; maybe some P leaches from putting green rootzones; maybe some was removed by coring and reduced by the addition of sand topdressing—I did not attempt to adjust for those core removal and topdressing effects.
The point I’d like to emphasize is that the P in the rootzone, as measured by Mehlich 3, goes down in a relatively predictable way, with only minor deviations from predicted values on an annual basis, although when those annual errors are accumulated over many years, the M3P tended to be lower than I would have predicted. That is, the soil P when down a little bit more rapidly than I would have predicted.
The “rootzone” I’ve been referring to is 10 cm in depth. But wait! There are more roots closer to the surface. When my recommendation year after year, as the M3P comes down from 200 to 150 to 100, is “don’t add P fertilizer,” the grass will get all the P it needs from the soil, but it can start to deplete the P near the surface.
That’s why I have recently been recommending that one out of every five greens tested—20% of the greens that you collect a sample from for soil testing—be divided at the 5 cm depth mark, and be submitted for testing as two samples. One is a 0–5 cm depth sample and the other is a 5–10 cm depth sample. By testing both the top half and the bottom half of the rootzone, we find out if the soil P content in the top of the rootzone is dropping to levels that may restrict turfgrass performance.
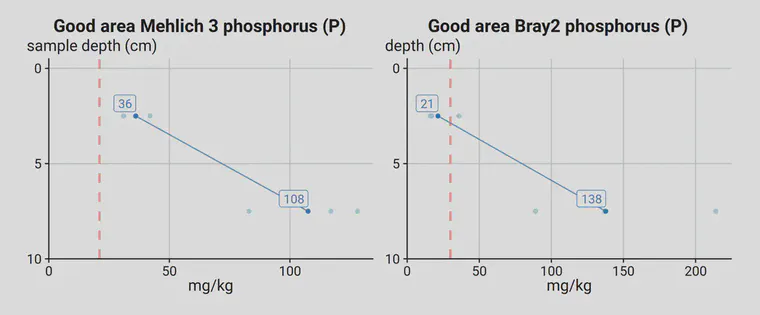
The test results from the 0–5 and 5–10 cm depths can be reconstructed back into their expected value had the sample been tested as a standard 0–10 cm depth. For example, the average Mehlich 3 P for the depth samples above is 73 ppm. Because these soils were also tested for soil organic matter, I make a bulk density adjustment for each depth to be as accurate as possible when making the calculation for 0–10 cm result from the combined 0–5 and 5–10 cm samples.
As the M3P gets lower, it doesn’t decrease in putting green soils as rapidly as expected. For example, in a rootzone with 20 ppm M3P, I’d expect the grass to use about 10 ppm, but the soil tends to stay pretty close to 20 ppm. Checking a green or two by depth can be useful to get a more detailed understanding of where the soil P is and where the grass is getting it from.