More on the daily soil water balance
How much irrigation is required at a particular location? That is an interesting question, and one gets widely different answers depending on the method used for calculation.
The standard method involves taking the consumptive water use and subtracting the effective rainfall. That seems like it would be an effective way to calculate how much irrigation is required. However, that method doesn’t explicitly consider the depth of the rootzone. Because managed turfgrass has a relatively shallow rootzone caused by low mowing heights, I think it makes more sense when making the calculations for turfgrass to find the irrigation requirement by using a daily soil water balance.
For a little background on this, see:
- Measurement of effective rainfall: daily soil moisture balance method
- The daily soil water balance at Sapporo from 2013 to 2016
- Daily versus monthly calculations of ET and irrigation requirement
I’ve made calculations of the daily soil water balance and from that calculated the irrigation water requirement.
As an example, this is the volumetric water content (VWC) of a 15 cm deep rootzone at Fukuoka in 2016, assuming irrigation was supplied when the soil would drop below a VWC of 10%, and that the quantity of irrigation supplied at each irrigation event was enough to fill the soil to field capacity.
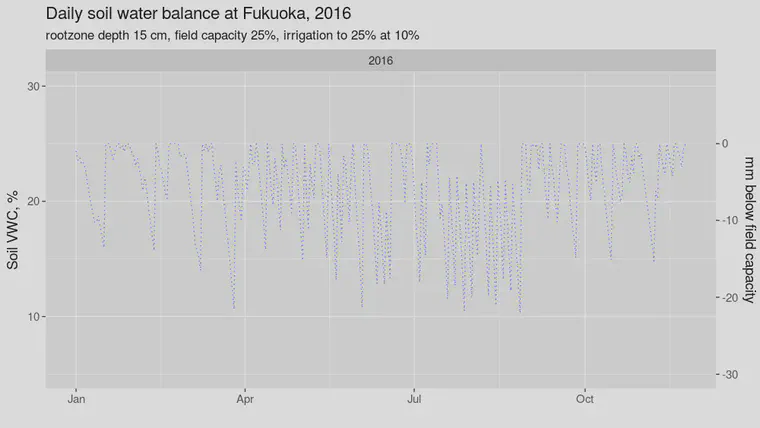
To get the quantity of water required for irrigation, one adds up the water required for each of the irrigation events. By using the weather data for a particular location, and by adjusting the rootzone depth and field capacity and irrigation rules for that location, the daily soil water balance gives a value for the irrigation requirement that should be close to the real one. By irrigation rules, I mean how much water is applied at each irrigation event, and what the threshold VWC is for applying irrigation.
For example, I calculated this for a 15 cm rootzone at Sapporo for the months of July, August, and September, using weather data for the past 10 years.
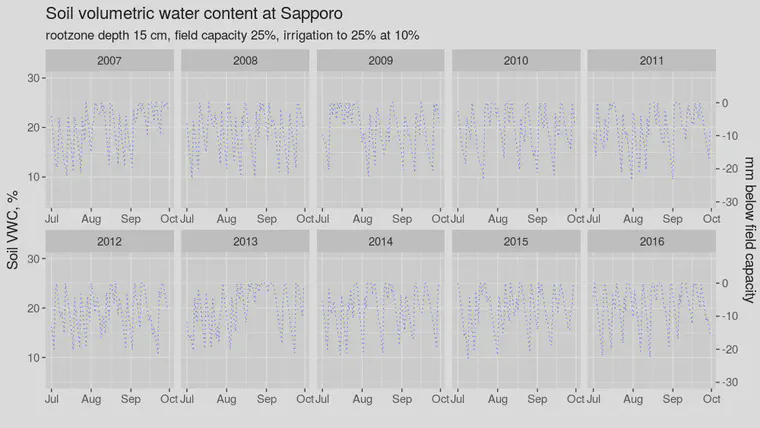
When I calculate the daily soil water balance and then add up the amount of water required as irrigation for a 15 cm rootzone depth with the rules as shown on the chart, only 2 of the 30 months on the chart had an irrigation requirement of zero. Those are September 2015 and September 2016. The month with the highest irrigation requirement was August of 2008, with 82.7 mm; July 2007 had an 82.3 mm irrigation requirement. The median irrigation requirement for those summer months at Sapporo for the past 10 years was 42.5 mm/month.
After I shared some charts of the VWC calculated from a soil water balance, Mike Williamson asked me about showing the annual quantity of plant water use together with the quantity of water required as irrigation.
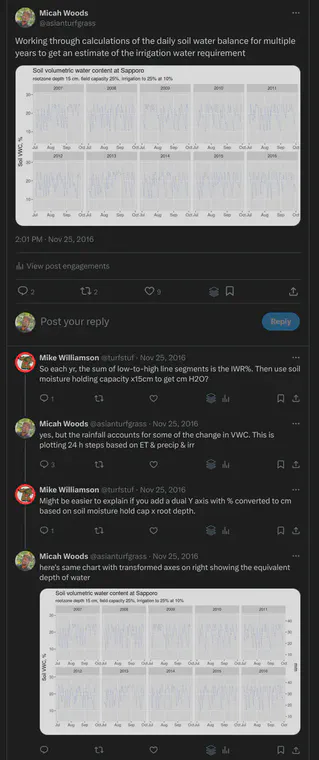
Those charts look like this for Sapporo, Fukuoka, and Naha:
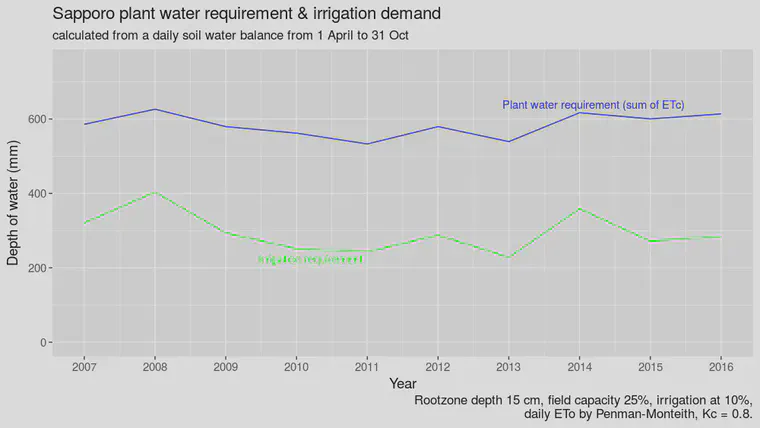
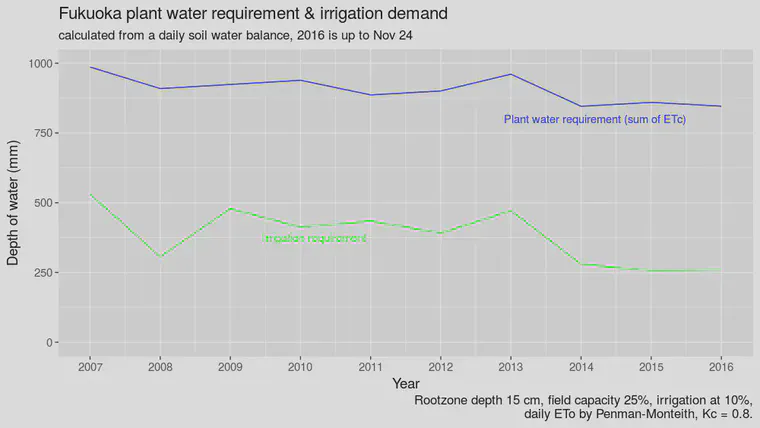
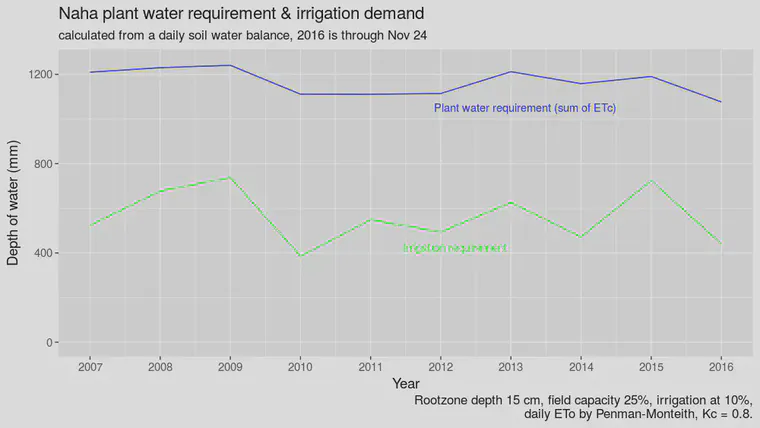
It rains a lot in Japan, so for a normal year, a large amount of the plant water requirement can be supplied by rainfall. That’s why the irrigation requirement and the plant water requirement lines are separated. The gap between the lines represents the amount of water that is supplied by effective precipitation.
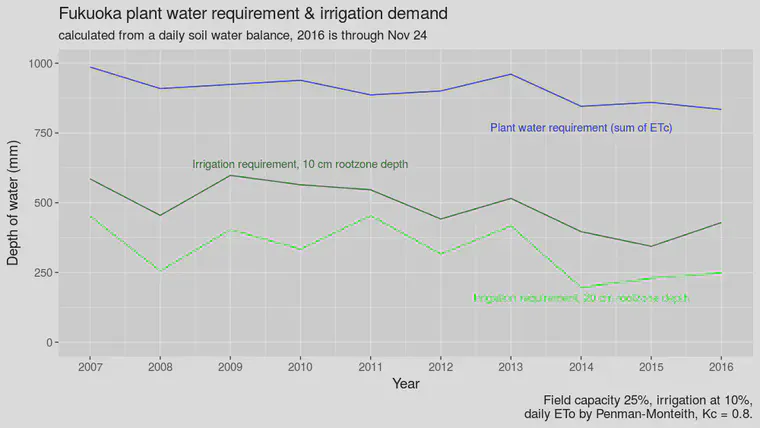
The rootzone depth and the irrigation rules will also have an effect on the quantity of irrigation water required. The previous charts were for a 15 cm rootzone depth. This shows the difference between a 10 and 20 cm rootzone at Fukuoka for the past 10 years.
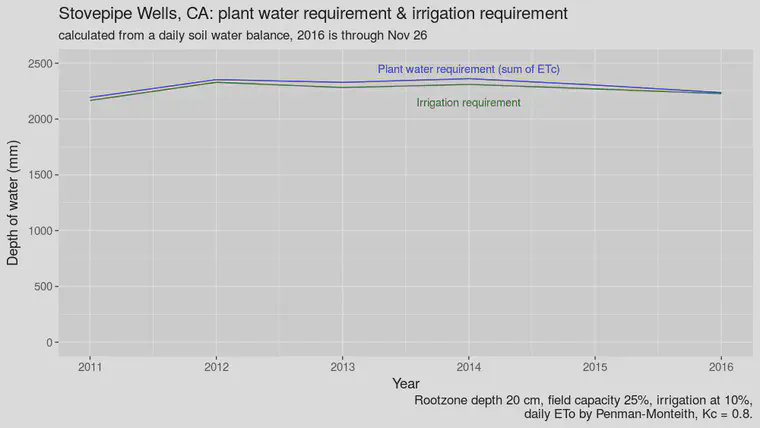
What about locations with less rainfall? Have a look at this chart with data from Stovepipe Wells in Death Valley, where it doesn’t rain much, and you’ll see the irrigation requirement by the daily soil water balance method is almost the same as the plant water requirement.
Gelernter et al. used a daily soil water balance in their analysis of water use on golf courses in the United States. This approach has many applications. For example, one can predict an irrigation requirement given past weather data. One can also compare the actual irrigation amount to the predicted amount. And one can adjust irrigation rules and other parameters in the daily soil water balance calculations to find what the change in irrigation requirement would be if those adjustments were made.