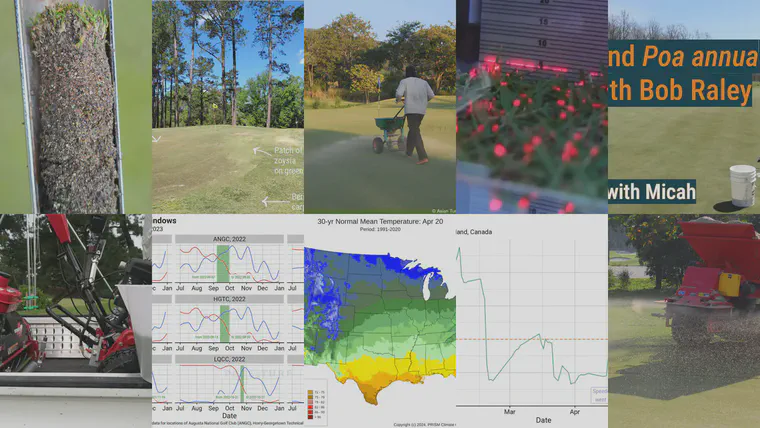
The top 10 posts of 2024
These posts had the most views in 2024.
They are on a nice balance of topics: temperature, sand topdressing, bentgrass and Poa annua and zoysiagrass and bermudagrass, playability, and the TurfGvX.

Here they are.
[1] June, Maps of average temperatures in the USA from the amazing PRISM Climate Group at Oregon State University. If you want to get some maps to explain how the weather has been influencing your work in the USA, that site can be useful.
[2] January, Annual sand topdressing amounts with a reminder that “some turfgrass managers have that number. Others don’t.” And I explain how to get that number, and I explain why it’s one you will want to know.
[3] February, Turfgrass GvX, nitrogen harvest, and fertilizer adjustment about adjusting N supply based on how much the grass is growing. Sounds simple. Is simple. Explained here.
[4] January, I was surprised to read this about nitrogen, coring, and sand topdressing and I hope you are surprised too.
[5] April, This is the kind of green where zoysia beats bermudagrass with an observation I made during one of my few golf rounds of the year.
[6] April, No Poa after 16 years is a great one. I’ve had a chance to visit Bob Raley and see the Poa-free surfaces at Thousand Acres during different seasons and I learn something new each time.
[7] January, Measuring effective cutting height with a laser with an innovative effective height of cut prism gauge.
[8] April, Optimum overseeding time windows explains a method to identify optimum overseeding times.
[9] May, Ball roll after 270 rounds about, well, basically the opposite of item [4] above. Surprised, but in a good way, about the results achieved by not doing what was recommended in [4].
[10] May, Turf GvX looks like this about what you can expect the TurfGvX—the turfgrass growth vs. the expected growth—to look like.
All ten of these are from the first half of the year! It’s normal for posts with more time on the site to get more views. But I don’t recall a year in which there were zero posts from the second half of the year on the top 10 list. This is partly to do with the increasing number of subscribers to the ATC blog email, where the RSS feed of the blog can be read by email without making a visit to the site. Overall more reads, but fewer counted as site visits. Then there is also the continuing decrease in activity among those who once would click on links posted there. And across social media in general, there aren’t a lot of clicks to read turf content. Visits to the ATC site from social media were down 20% from 2023 to 2024, with visits from links posted on down 30%.
Despite those trends, there were still 15% more pageviews on the ATC website in 2024 compared with 2023, and 22% more active users.
If you want to scroll through all the posts, here are two lists of ATC posts that you may not have seen:
- the secret ATC archive page with post titles listed in reverse chronological order
- scrolling down the authors/admin page goes past my profile and lists all the Latest posts by me, and actually lists all of them