A turf (and soil) paradox
Soil nutrient levels are often higher under poor turf and lower under good turf
The usual way of thinking about soil nutrients and turf quality is something like this: when the amount of a soil nutrient is low, the turf quality won’t be as good as it would be if that nutrient were more abundant in the soil. There is an implied cause and effect in that thinking. The nutrient content of the soil would be the cause, and the change in turfgrass quality would be the effect. Makes sense, right? Sometimes it can work the other way, however. That’s what this post is about, and I’ll use soil test phosphorus (P) data as an example.
What if the turf quality was better when the soil P was lower, and then as the soil P increased, the turf quality declined? That paradoxical situation is common. It happens when P is not low enough to cause a decline in turfgrass performance, and when P fertilizer is applied at reasonable rates.
Spoiler alert: what I mean by reasonable rates
By reasonable rates I mean something like MLSN. Because P is relatively immobile in soil, one will see this effect when the grass uses (by uptake from the roots of actively growing grass) an element that is present in ample amounts in the soil while that element is being applied as fertilizer at rates less than the rate the grass is using that element.
In that case, the turf that grows better is going to remove more P from the soil, causing a decline in soil test P.
Here’s an example.
Greens with good and bad areas
One of ATC’s soil testing clients wrote a couple years ago with this inquiry:
You have any idea what this could be? Seems like it is getting worse.
Any kind of deficiency maybe? Could it be like a spot deficiency in phosphorus? I have always thought it just got dry but …"
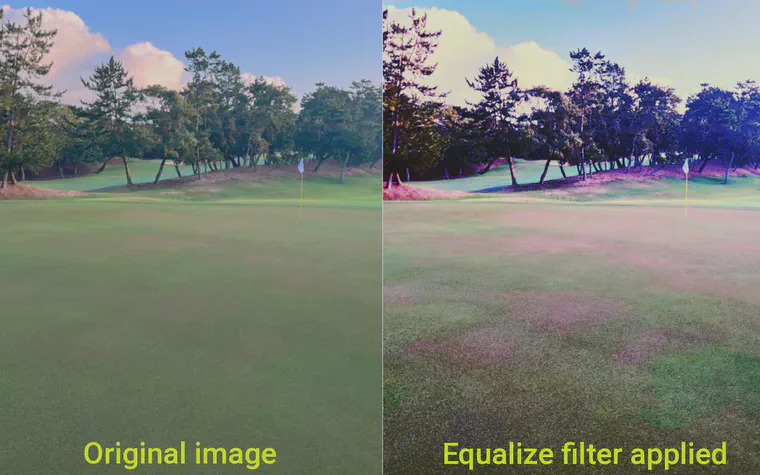
After seeing the photos, I wrote back:
The [guess that it might be] P deficiency is a good idea. I recommend collection of samples to a 5 cm depth and to 10 cm depth and from good and bad areas. By doing the soil test we can at least eliminate P as the cause, or identify it as a potential cause.
Soil test P in good and bad areas
Soil samples were collected immediately. There were a total of 12 samples sent to the lab from three greens at the course with the possible P deficiency symptoms.
- Subsamples were collected from the bad areas, and from the good areas
- Each of the three greens then had one sample from good turf, and one from bad turf
- Samples were divided into 0–5 and 5–10 cm depths to check the P gradient in the soil
When the test results came back from Brookside Labs, where each of the 12 samples got a complete soil nutrient analysis that included both a Mehlich 3 test for P, and a Bray 2 test for P, I checked the results. The Bray 2 test results for P were similar to what was measured by Mehlich 3. The results shown here are Mehlich 3 test results.
So, were those weak areas on the greens P deficiency symptoms? Based on the test results, that is highly unlikely.
In the top 5 cm (top 2 inches), the average P from the good areas was 36 ppm. From the bad areas, the average was 43 ppm. These were paired tests, with one good sample and one bad sample per green. The difference between the good and bad areas on one green was -8 ppm (the good area had 8 ppm less P than did the bad area), on another green the difference was also -8, and on another green the difference was -4.
Is that statistically significant, or just a chance occurrence? I did a Bayesian analysis,1 which I prefer, so we can refer directly to the probabilities from the posterior distributions generated by the model.
With those test results, I had a prior assumption that the good areas would have more P at the top of the rootzone, and that the bad areas would have less. I expressed that as a prior (normal distribution with a mean of 5 and a standard deviation of 8). I wasn’t sure what the difference would be, but I didn’t really think it would be 0, and expected it probably was greater than 0.2
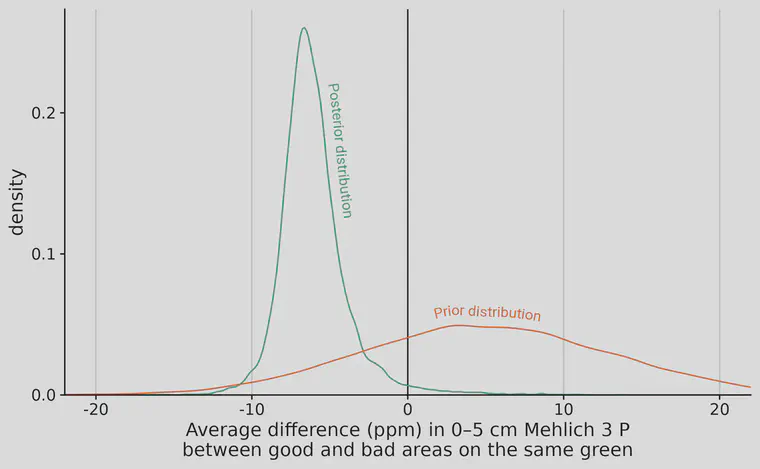
Then I collected the data. Given the test results that were actually measured, the posterior distribution has 98% of the values less than 0. There’s a 98% probability that the soil P under the good turf areas was actually lower than the soil P under the bad areas.
When you think about it, it makes sense that this would be the case. The greens had not been fertilized with P more than five years. The clippings were harvested from the greens after mowing. Where the grass was healthier and producing more leaves, there would be more P removed from the soil. Over time, P was depleted at the top of the rootzone.
Soil test P on 30 putting greens
The example above was for one golf course. Would this paradox extend to other situations as well?
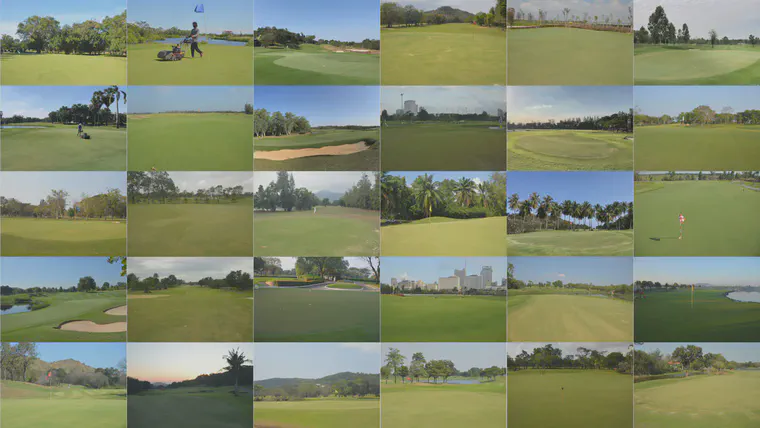
For a project in Thailand, I gathered soil samples (in collaboration with Brad Revill from BRT Agronomy) from 30 putting greens. The greens were rated on a 5 point scale. All greens rated “acceptable conditions” and higher are classified here as “good;” all greens rated “easy to see how it could be made better” and worse are classified here as “poor.”
I started off with the assumption that the Mehlich 3 P would be about 60 ppm on average. The median Mehlich 3 P in the Global Soil Survey was 68 ppm. That’s where the 60 ppm prior came from.
After checking the test results, the average Mehlich 3 P for the good greens was 30 ppm. The average Mehlich 3 P for the greens rated poor was 43 ppm.
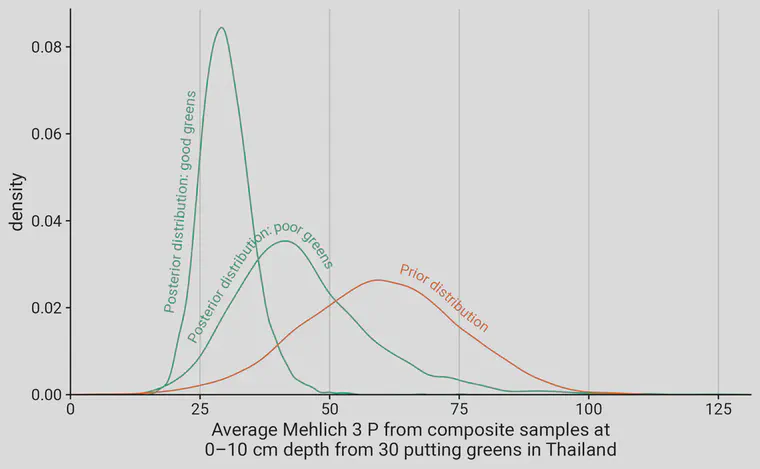
Once again, the soil P was lower under the good turf, and higher under the poor turf.
By taking the difference of the posterior distributions above, the posterior distribution of the differences between good and poor green Mehlich 3 P is obtained.
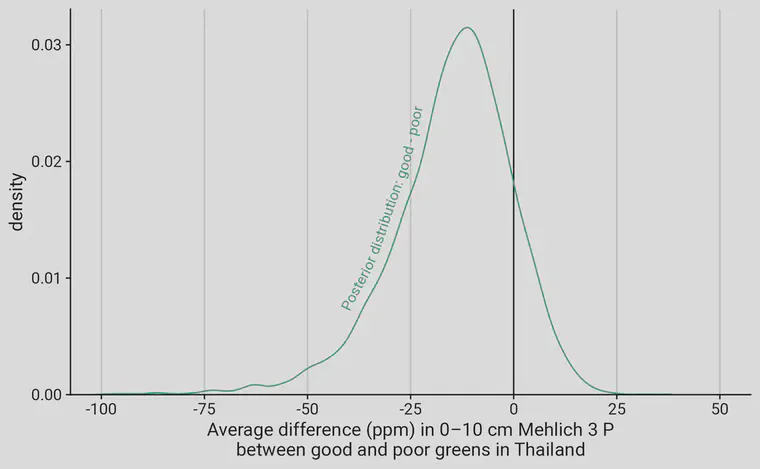
Given the model I used, and the Mehlich 3 P data from those 30 greens, there’s an 87% probability that the average P from the good greens is lower than the average P from the poor greens.
What to do about this?
Nothing. Just be aware of this phenomenon. If you weren’t aware of this before, knowing that it happens can help you put your soil test results and fertilizer recommendations into context.
And as usual, I recommend using MLSN for determining fertilizer rates based on soil test results. When using MLSN, the fertilizer recommendation is not based on probability of response to a fertilizer application. The recommendation is based on how much of an element is in the soil, and how much of that element the grass is expected to use. Because of the way the MLSN guidelines were developed, we have a high level of confidence that when the grass is supplied with enough of an element to keep the soil level at or above the MLSN minimum for that element, the grass will have enough of that element.3
With this approach, one can apply reasonable amounts of fertilizer, ensuring the grass is supplied with all of the nutrients it can use. There’s no paradox in that.
The standard frequentist method to check for statistical significance with this type of data is to do a t-test. For a t-test with 2 degrees of freedom, testing a null hypothesis that the soil P was actually higher in the good turf than in the bad turf returns a p-value of 0.02. With a p-value that low, it is customary to reject that null hypothesis. ↩︎
That prior put 73% of the probability, before considering what the actual soil test results were, that the average difference in Mehlich 3 P between good and bad areas on those greens would have been greater than 0. That is, 73% prior probability that Mehlich 3 P was higher in soils under good turf, and lower in soils under bad turf. ↩︎
In the two examples described above, note that the good turf areas had a lower Mehlich 3 P value than did the poor turf areas. Note also that the good turf areas had a Mehlich 3 P that is above the MLSN minimum for P. As the soil test P decreases and gets closer to the MLSN minimum, the fertilizer recommendation for P goes up. ↩︎