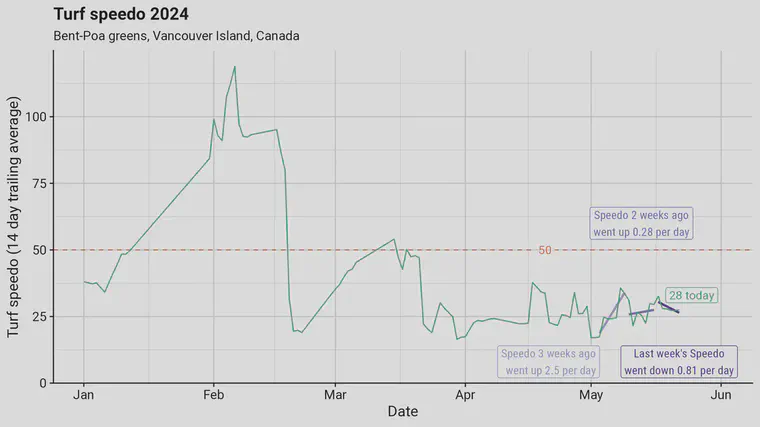
Turf GvX looks like this
I’ve been looking at some growth ratio data, and I’ll share a few ideas here.
- Jason Haines introduced this as the turfgrass speedo, and I think that’s a good name for it. Maybe a better one than growth ratio. I’ve got two reasons for preferring speedo now, despite my having called this the growth ratio for the past few years.
UPDATE on 2024-08-11: Let’s call this GvX for growth versus expected. Read about it here.
Reason one: a Google search for “growth ratio” will turn up a lot of investment and economic and business documents with that terminology. A search for “turf speedo”, on the other hand, turns up information about the turf speedo.
Reason two: ratios of 0.27 and 0.43 and 1.29 don’t mean much, especially to someone new to this calculation. Those numbers also involve decimal points. How about calculate the speedo as usual, and multiply it by 100 to get rid of the decimal point. Now, a speedo of 50 seems reasonable. If the speedo is 30, that seems like a safe, slow speed. 200 sure seems fast. But if you are on the highway and need to be going 80, then a speedo of 40 would be dangerously slow. To me, the speedo is easier to communicate and perhaps a bit easier to grasp if expressed as an integer value.

- The chart above shows the speedo for a course with bent-Poa greens in western Canada for the first months of 2024. I have been calculating the speedo using a 14 day trailing average. At the moment, I’m finding it useful to look at three things. I look at the speedo today—for the chart shown above, the speedo is at 28. I also look at the overall trend of the speedo over time. In this case, it’s been hovering around 25 since late March. And I look also at the weekly trend for each of the past three weeks. With this quick look at what the speedo is at and how it has been changing, I can compare that knowledge to whatever my desired speedo is, and I can adjust N and plant growth regulators (and other work) accordingly.